
After a lot of overthinking I have decided to make all of my metrics public on a single dashboard. The newly created dashboard shows revenue, engagement and signups for Keepthescore.com. Click here to see the dashboard.
To be clear, this is less radical that it actually sounds. Others have been taken this path before such as Buffer.com or Ghost.org.
Why am I doing this?
The main reason is marketing. I think that publishing your metrics and being transparent demonstrates that you have nothing to hide. It increases trust. But mainly: it provides a great story to tell.
I’m hoping it will also get a small subset of users coming back more often. An online dictionary I used in the past would share its website analytics with its users: I found this fascinating and always had a peek when I was on the page.
Hopefully it will also give me a minor SEO boost. Publishing your metrics makes you a so-called “open startup” which means you can get listed on sites like this one.
Finally, it’s a good way of gaining the interest of potential buyers for the product in the future.
Overall, it’s something to try out and see if it works. The moment it doesn’t work I’ll take the page offline again.
Am I publishing ALL of my metrics?
Nope, I have a lot more metrics that I don’t publish. I use Metabase (which is an excellent and free tool) to display various things from my database. Here’s an example of one of my dashboards:
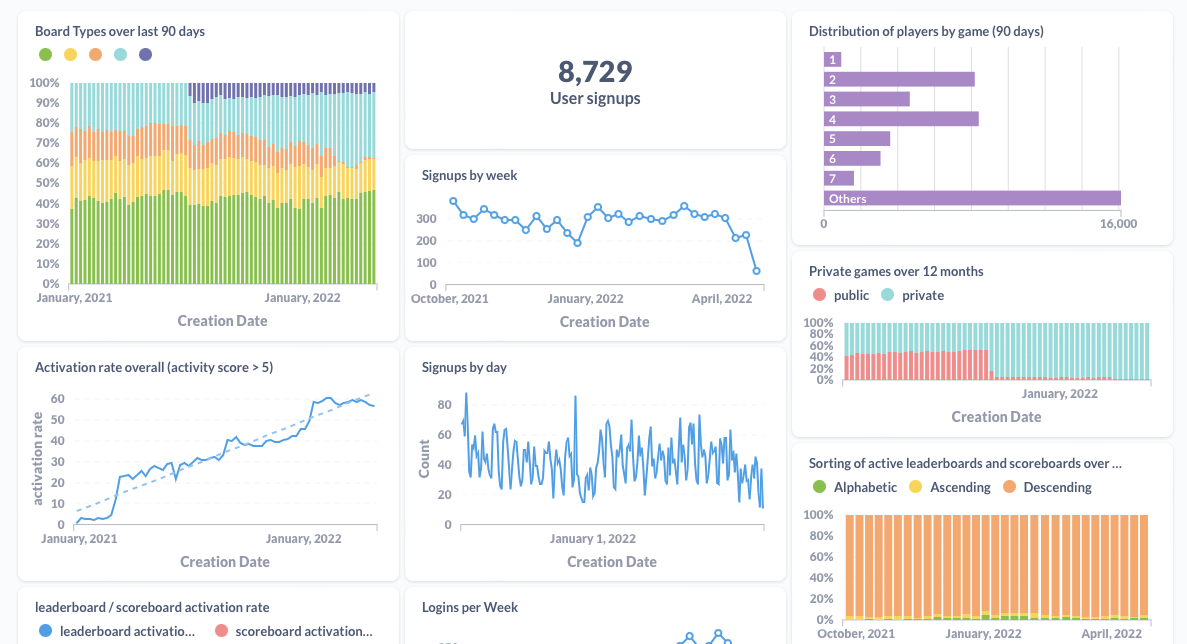
I am not publishing all my metrics because it would be overwhelming and there is some actionable data in there that I don’t want to share.
Am I worried about competitors?
Keepthescore has 2 copycats right now and this data could motivate them to try harder. But I’m not worried. I work full-time on my product and looking at their products it seems like they don’t.
Also, I have insights generated from running the product. I have a road-map that is informed by talking to users. I have a mailing list of users. This is a competitive advantage that the copycats cannot emulate.
Will I be adding more metrics?
Yes. I will be adding traffic metrics in the near future. Also, I’m using AdSense banner ads, and the revenue will be added to the dashboard soon.
What technologies are used for the dashboard?
To create the dashboard, I pull all the data from the production database and then use Chart.js to display it. The backend uses Python Flask, like the rest of the product. The styling is done with Bootstrap.
The data is cached for 15 mins, which means that after 15 mins, fresh data is fetched from the database. Otherwise “old” cached data is used. I do this because fetching the data puts quite a lot of load on the database.
Anyway, that’s all for now. You can follow my journey on Twitter. If you have questions or feedback, then please comment below.
Thanks for reading this 100% hand-written post! Follow me on LinkedIn for more or check out my projects.